Some Comparitive Score Statistics

Get or give advice on equipment, reloading and other technical issues.

Moderator: Mod

Message
Author
AlanF
Posts: 7501
Joined: Wed Jun 15, 2005 8:22 pm
Location: Maffra, Vic

Some Comparitive Score Statistics

#1 Postby AlanF » Mon Nov 24, 2014 8:42 am

I have just completed a comparison of accuracy performance between TR and the 3 F-Classes as the basis of the next version of the MCSI (Multiple Category Score Index) system using statistics from all Australian 2014 Queens events.

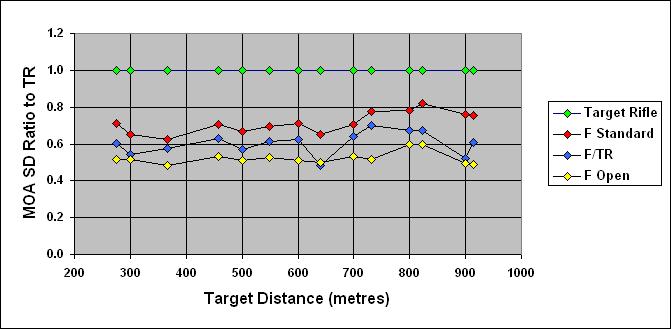
If my methods are sound, then it appears that at Queens level, F/TR sits between F-Std and F-Open in terms of accuracy, slightly closer to F-Open in fact. Across all distances, F-Std groups are about 72% of TR, F/TR about 62%, and F-Open 53%. Because of the relatively small fields in F/TR, the stats are less reliable, as seen by its more erratic (blue) line on the graph below. The graph reveals that the best relative performance of TR occurs at around 800m to 900y. This suggests they may be better long range wind readers, but are disadvantaged significantly at 900m and 1000y by ballistically inferior projectiles. I'm puzzled by the fact that F-Std regains some lost ground after 900y. Is it because they run hotter loads?

Image

Note that this comparison uses median scores, so may not reflect what you see with winning scores. The median score from each class at every Queens (not leadup) range in 2014 (there were 82) was input, and processed as follows :
  • Scores were converted by adding Vs (or Xs) to points
  • A Standard Deviation (in MOA) for each converted score was deduced using a typical shots profile for a given score
  • For every one of the 82 ranges, the ratio of each F-Class SD to the TR SD was calculated
  • For the graph and the overall figures, the SDs were summarised using some weighting according to the numbers in the classes.

I'll be producing new MCSI tables for 2015 based on these statistics. Until now, due to lack of F/TR data, they have had to be lumped in with F-Std. In hindsight, perhaps they should have been scored exactly halfway between F-Std and F-Open!

BATattack
Posts: 1280
Joined: Mon Dec 29, 2008 10:29 pm

Re: Some Comparitive Score Statistics

#2 Postby BATattack » Mon Nov 24, 2014 10:10 am

Very interesting lot of data but I might not be looking at it correctly but it seems that FO is averaging .5moa and TR 1moa? Surly that can't be correct or we would have to somehow have scores better than 60.10 (.5moa?) To average out the ones that are worse than that? Sorry I'm probably not reading it correctly with the MOA scale is set up?

AlanF
Posts: 7501
Joined: Wed Jun 15, 2005 8:22 pm
Location: Maffra, Vic

Re: Some Comparitive Score Statistics

#3 Postby AlanF » Mon Nov 24, 2014 10:26 am

Adam,

It isn't specifying any actual group sizes. The 53% figure says that F-Open shooters were on average shooting groups about half the size of TR groups, at all distances in all conditions encountered during 2014 Queens shoots. So if the median (placed midway in the field) TR shooter shot say a 1 minute group, the median F-O shooter could be expected to shoot approx a half minute group. Although if you look at the graph at 800m, the median F-Open group would be approx 60% the size of the median TR group. So the relationship is not quite the same for all distances.

Alan

aaronraad
Posts: 573
Joined: Wed Aug 08, 2012 3:43 pm
Location: Brisbane, Australia
Contact:

Re: Some Comparitive Score Statistics

#4 Postby aaronraad » Mon Nov 24, 2014 10:38 am

Yeh, but is you took out Mark Fairbairn's scores where would F/TR be then. :P
Be careful what you aim for, you might hit it! Antipodean Industrial - Home of the G7L projectiles

williada
Posts: 969
Joined: Wed Jul 22, 2009 12:37 am

Re: Some Comparitive Score Statistics

#5 Postby williada » Mon Nov 24, 2014 12:02 pm

Alan, great stats and you might think I am left field with the following comments. I think the answer to your puzzle comes from compensation forces. When Fullbore shooters make the transition to scope, they bring sound wind reading skills to that class, but often they bring a rifle that has a longer whippier barrel than other scoped classes from Fullbore. In many cases, shooters may not use the full weight allowed. So I feel these rifles may be compensating more readily than the other gear at the longer ranges more so than shooters being skilled wind readers.

These rifles can use a fundamental lift in the barrel to tap into to tune; whereas, the heavy setups tend to be limiting tune to secondary and tertiary pulses of the barrel. Tunes in heavy setups tend to be about the mini peaks or troughs in neutral barrels or a harmonic node which mimics the neutral barrel. I have been seeing this in a number of groups sent to me for examination recently.

I noticed that the heavy, shorter and stiffer barrels can be still be compensating positively on a pulse in a neutral barrel in the heavy setups past 500 and indicated just past 600 by your stats (which are a bigger sample). Note the relative dips in three scoped rifles at three hundred, five hundred and 6 ½ in your stats where dispersion was smallest. Anything the other side of positive falls off quickly and you may be seeing this effect about 700 with the latent effect a bit further out for F/Open. I also know Three and Five hundred are common distances to tune which may explain the greater dispersion from 700 in compensation terms. I note the dispersion decreases again at long range. You would not expect this given target dimensions and the forces of wind and could we assume the same load for all distances. If that was the case it would be positive compensation. Or maybe rounder numbers are easier to use in wind calculation? F/Standard does not change the projectile. F/Open may use another calibre which has greater wind bucking ability, but the trends seem to be there.

It would be interesting to see if you did a small sample of the top shooters to see these trends where still evident. Its a big assumption, but it be a way of trying to minimise the wind reading ability of the shooter to determine what the class of rifle is capable of and how it is doing it. Not that this is actually relevant to a handicap system based on the spectrum of shooters and their results.

AlanF
Posts: 7501
Joined: Wed Jun 15, 2005 8:22 pm
Location: Maffra, Vic

Re: Some Comparitive Score Statistics

#6 Postby AlanF » Mon Nov 24, 2014 1:43 pm

williada wrote:Alan, great stats and you might think I am left field with the following comments. I think the answer to your puzzle comes from compensation forces. When Fullbore shooters make the transition to scope, they bring sound wind reading skills to that class, but often they bring a rifle that has a longer whippier barrel than other scoped classes from Fullbore. In many cases, shooters may not use the full weight allowed. So I feel these rifles may be compensating more readily than the other gear at the longer ranges more so than shooters being skilled wind readers.

These rifles can use a fundamental lift in the barrel to tap into to tune; whereas, the heavy setups tend to be limiting tune to secondary and tertiary pulses of the barrel. Tunes in heavy setups tend to be about the mini peaks or troughs in neutral barrels or a harmonic node which mimics the neutral barrel. I have been seeing this in a number of groups sent to me for examination recently.

I noticed that the heavy, shorter and stiffer barrels can be still be compensating positively on a pulse in a neutral barrel in the heavy setups past 500 and indicated just past 600 by your stats (which are a bigger sample). Note the relative dips in three scoped rifles at three hundred, five hundred and 6 ½ in your stats where dispersion was smallest. Anything the other side of positive falls off quickly and you may be seeing this effect about 700 with the latent effect a bit further out for F/Open. I also know Three and Five hundred are common distances to tune which may explain the greater dispersion from 700 in compensation terms. I note the dispersion decreases again at long range. You would not expect this given target dimensions and the forces of wind and could we assume the same load for all distances. If that was the case it would be positive compensation. Or maybe rounder numbers are easier to use in wind calculation? F/Standard does not change the projectile. F/Open may use another calibre which has greater wind bucking ability, but the trends seem to be there.

It would be interesting to see if you did a small sample of the top shooters to see these trends where still evident. Its a big assumption, but it be a way of trying to minimise the wind reading ability of the shooter to determine what the class of rifle is capable of and how it is doing it. Not that this is actually relevant to a handicap system based on the spectrum of shooters and their results.

I think you could be onto something there Dave. I've just ordered a 34" barrel 1.1" parallel profile, so you don't need to convince me :D .

BATattack
Posts: 1280
Joined: Mon Dec 29, 2008 10:29 pm

Re: Some Comparitive Score Statistics

#7 Postby BATattack » Mon Nov 24, 2014 7:45 pm

AlanF wrote:Adam,

It isn't specifying any actual group sizes. The 53% figure says that F-Open shooters were on average shooting groups about half the size of TR groups, at all distances in all conditions encountered during 2014 Queens shoots. So if the median (placed midway in the field) TR shooter shot say a 1 minute group, the median F-O shooter could be expected to shoot approx a half minute group. Although if you look at the graph at 800m, the median F-Open group would be approx 60% the size of the median TR group. So the relationship is not quite the same for all distances.

Alan


Thanks Alan! I think the key word I missed in on the scale was "relative" MOA!

Norm
Posts: 837
Joined: Fri Jul 23, 2010 10:21 pm
Location: Gippsland, Victoria

Re: Some Comparitive Score Statistics

#8 Postby Norm » Mon Nov 24, 2014 9:27 pm

Alan, did you use A-Grade, TR scores or all three grades?

AlanF
Posts: 7501
Joined: Wed Jun 15, 2005 8:22 pm
Location: Maffra, Vic

Re: Some Comparitive Score Statistics

#9 Postby AlanF » Mon Nov 24, 2014 10:08 pm

Norm wrote:Alan, did you use A-Grade, TR scores or all three grades?

All 3 grades combined. And both grades/divisions of F-Std. And median scores were extracted AFTER adding Vs and Xs.

Daniel Chisholm
Posts: 53
Joined: Thu May 03, 2012 8:40 pm
Location: Canada

Re: Some Comparitive Score Statistics

#10 Postby Daniel Chisholm » Mon Nov 24, 2014 11:22 pm

What a great graph!

I would also be very interested in seeing what it looked like without normalizing the group sizes; it would be neat to see the actual group size SD for TR/FTR/FS/FO shooters, across the different distances.

Not necessarily of general interest, but I am intensely curious about the details behind "A Standard Deviation (in MOA) ... was deduced using a typical shots profile for a given score". I agree with this approach, am curious whether you modelled it as a round group, and if not, how you figured out how much more to smear it sideways for wind effects.

AlanF
Posts: 7501
Joined: Wed Jun 15, 2005 8:22 pm
Location: Maffra, Vic

Re: Some Comparitive Score Statistics

#11 Postby AlanF » Tue Nov 25, 2014 12:58 am

Daniel,

The only scores I have used are the median scores for each of the 4 classes at each range. Because conditions vary both within and between meetings, and quality of fields varies also, the absolute SDs of median scores do not really have much meaning until you compare them with the other classes shooting concurrently, which is what the ratios do. However I can make the underlying median scores (converted by adding Vs and Xs) and the SDs "derived" from them available.

To get an SD from a score, I wrote a simulation program that uses an initial guess of MOA SD and iterates until the SD is accurate to less than 0.001 MOA. It can be set to "fire" up to 2000 shots for each iteration. Each shot lands neatly in its own uniformly allocated area under the probability curve and is scored according to the target rings for that distance. The method doesn't differentiate between windage and elevation accuracy - it is only concerned with "distance from middle" in MOA.

If you have a good understanding of Excel (with a couple of VB macros) then I'm happy to send you a copy of the worksheet, which also contains all of the base data used.

Alan

Daniel Chisholm
Posts: 53
Joined: Thu May 03, 2012 8:40 pm
Location: Canada

Re: Some Comparitive Score Statistics

#12 Postby Daniel Chisholm » Tue Nov 25, 2014 9:39 am

Alan - would love to see the spreadsheet. Not for the formulas (your explanation is complete and tells me everything I was looking for), but I am curious about the raw MOA group sizes being shot by TR etc, even with your cautionary explanations about interpreting it.


Return to “Equipment & Technical”

Who is online

Users browsing this forum: No registered users and 67 guests